FAQ/ DioVISTA Stormとの違いは何ですか
日立パワーソリューションズのソフトウェア DioVISTA Flood と DioVISTA Storm とはよく似ています。違いは何ですか。
回答
気候変動による大雨・洪水リスク増加に対応する情報技術を提供するために、日立パワーソリューションズでは DioVISTA Flood および DioVISTA Storm を開発・販売しています。
これらはどちらも全球3次元GISであるDioVISTAに機能をプラグインした製品です。
DioVISTA Floodは洪水のシミュレーション機能を提供します。
DioVISTA Stormは、シミュレーションデータの可視化機能を提供します。NetCDFファイルを3次元地図上で可視化することに適したソフトウェアです。
| 製品 | DioVISTA Flood | DioVISTA Storm |
|---|---|---|
| 目的 | 洪水の解析、予測 | 解析・観測データの可視化 |
| 発売開始 | 2006年6月 | 2014年8月 |
| イメージ | 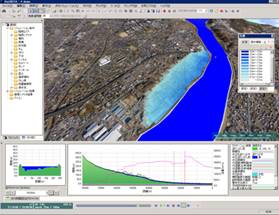 |
 |
DioVISTA Storm の可視化サンプル
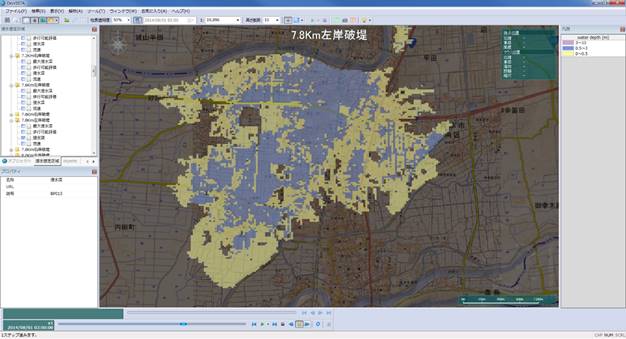
浸水想定区域図
使用したデータ
Flood simulation data: Ministry of Land, Infrastructure, Transport and Tourism (Gov. of Japan)
Map & terrain data: Geospatial Information Authority of Japan
この地図の作成に当たっては、国土地理院長の承認を得て、同院発行の基盤地図情報及び電子地形図(タイル)を使用した。(承認番号 平29情使、第641号)
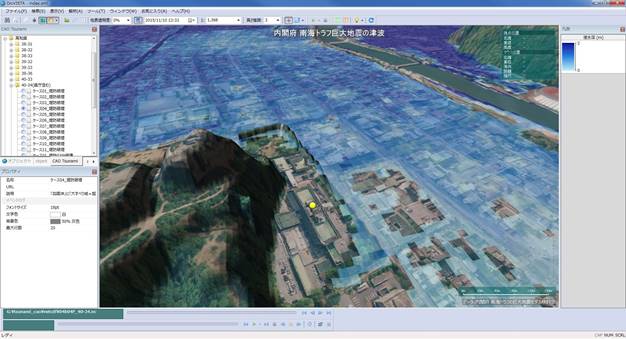
津波シミュレーション
使用したデータ
Tsunami simulation data: Disaster Management, Cabinet Office (Gov. of Japan)/ 内閣府 南海トラフの巨大地震モデル検討会
Map & terrain data: Geospatial Information Authority of Japan
この地図の作成に当たっては、国土地理院長の承認を得て、同院発行の基盤地図情報及び電子地形図(タイル)を使用した。(承認番号 平29情使、第641号)
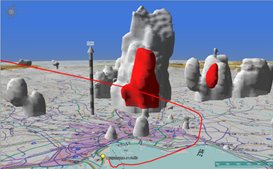
大気拡散シミュレーション
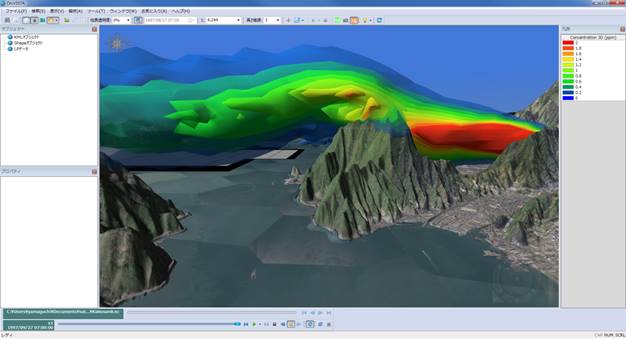
使用したデータ
Air pollution simulation data: Hitachi Power Solutions, Co., Ltd. Kakusan-Suketto/ 日立パワーソリューションズ かくさんすけっと Map: Geospatial Information Authority of Japan この地図の作成に当たっては、国土地理院長の承認を得て、同院発行の基盤地図情報及び電子地形図(タイル)を使用した。(承認番号 平29情使、第641号)
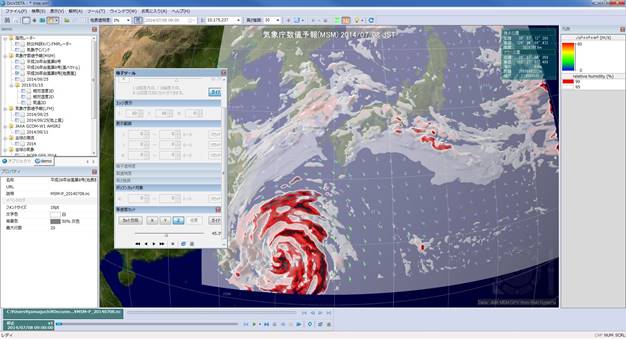
メソ数値予報モデルGPV (MSM)
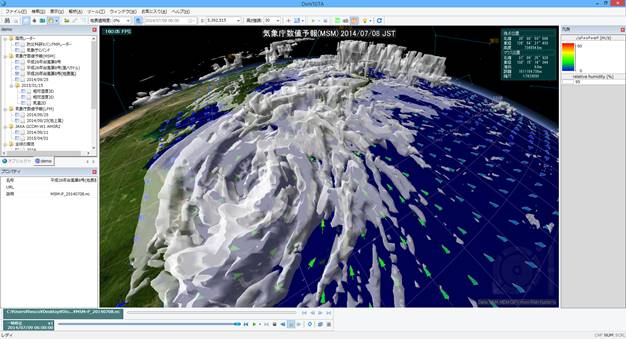
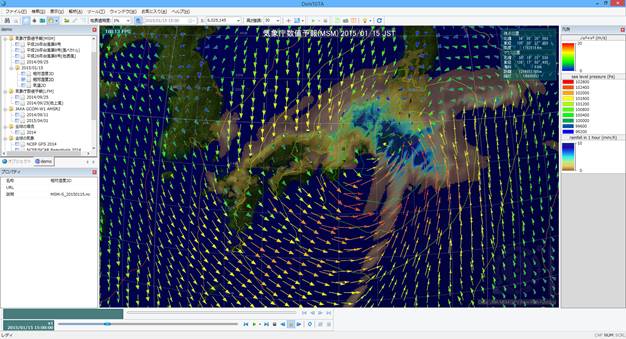
使用したデータ
Numerical weather forecast (meso scale model): Japan meteorological Agency
Blue Marble: Next Generation courtesy of NASA Earth Observatory. Landsat image courtesy of the Global Land Cover Facility (GLCF).
Using high-resolution digital topography data from NASA's Shuttle Radar Topography Mission (SRTM).
局地数値予報モデルGPV (LFM)
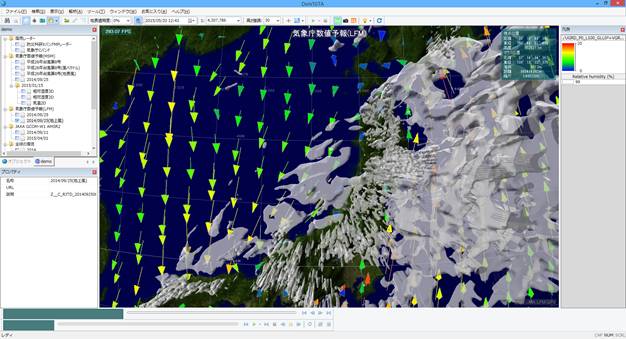
使用したデータ
Numerical weather forecast (local forecast model): Japan meteorological Agency
Blue Marble: Next Generation courtesy of NASA Earth Observatory. Landsat image courtesy of the Global Land Cover Facility (GLCF).
Using high-resolution digital topography data from NASA's Shuttle Radar Topography Mission (SRTM).
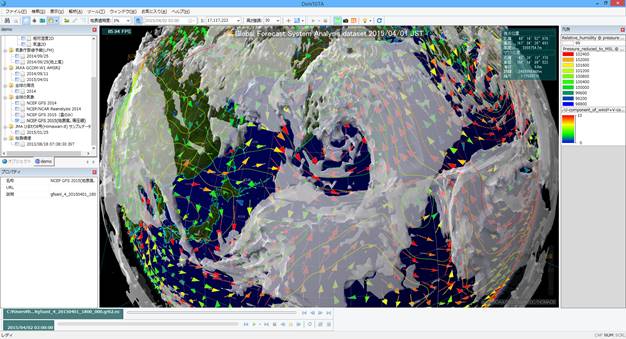
NOAA Global Forecast System
使用したデータ
NCEP High Resolution Global Forecast System Analysis dataset (GFS-ANL 004 (0.5 degree)) provided by the NOAA/NESDIS/NCDC/NOMADS from their Web site at http://nomads.ncdc.noaa.gov/data.php#hires_weather_datasets
Blue Marble: Next Generation courtesy of NASA Earth Observatory. Landsat image courtesy of the Global Land Cover Facility (GLCF).
Using high-resolution digital topography data from NASA's Shuttle Radar Topography Mission (SRTM).
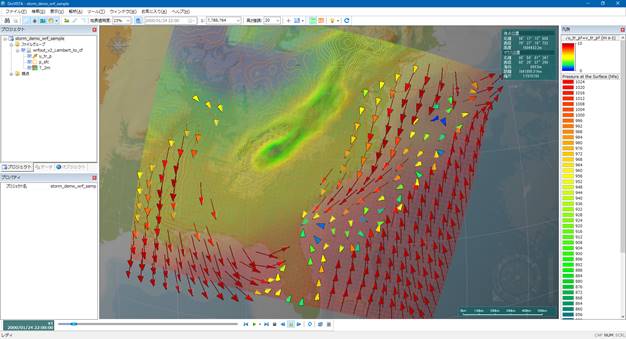
WRF
使用したデータ
WRF sample data: UCAR Example netCDF files, https://www.unidata.ucar.edu/software/netcdf/examples/wrfout_v2_Lambert.nc Map: Geospatial Information Authority of Japan この地図の作成に当たっては、国土地理院長の承認を得て、同院発行の基盤地図情報及び電子地形図(タイル)を使用した。(承認番号 平29情使、第641号)
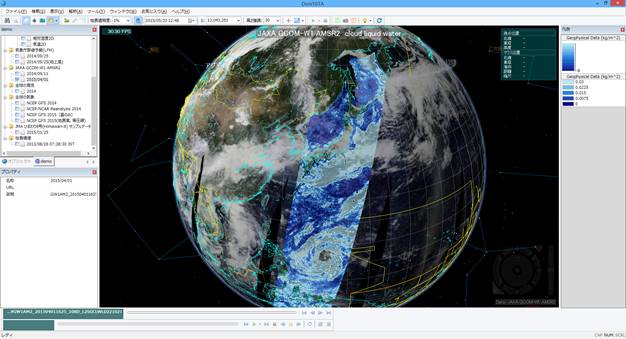
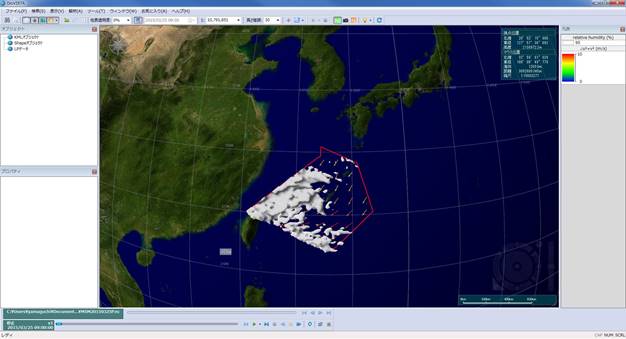
JAXA GCOM-W1 AMSR2
使用したデータ
GCOM-W/AMSR2, Japan Aerospace Exploration Agency GCOM-W1 data provider service, http://gcom-w1.jaxa.jp/
We acknowledge the use of imagery produced by services from the Global Imagery Browse Services (GIBS) operated by the NASA/GSFC/Earth/ Science Data and Information System (ESDIS) with funding provided by NASA/HQ.
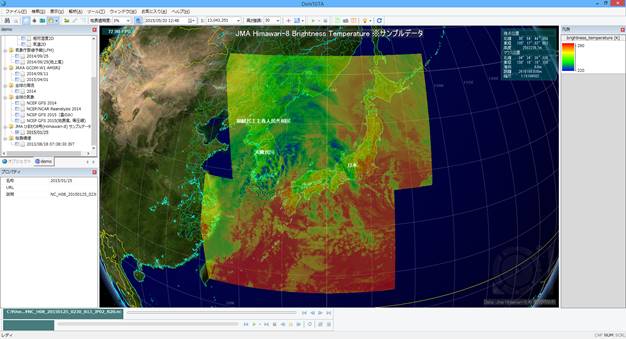
気象庁ひまわり8号
使用したデータ
Weather satellite Himawari-8 sample data : Japan meteorological Agency
Blue Marble: Next Generation courtesy of NASA Earth Observatory. Landsat image courtesy of the Global Land Cover Facility (GLCF).
Using high-resolution digital topography data from NASA's Shuttle Radar Topography Mission (SRTM).
黒潮の流れデータ
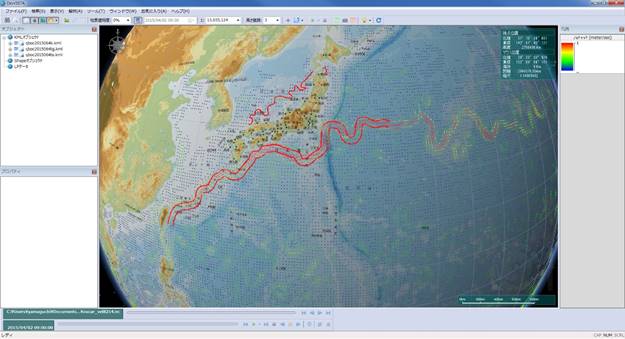
使用したデータ
Ocean Surface Current Analysis (OSCAR) data were obtained from JPL Physical Oceanography DAAC and developed by ESR.
Kuroshio position: Japan Coast Guard
Map: Geospatial Information Authority of Japan
この地図の作成に当たっては、国土地理院長の承認を得て、同院発行の基盤地図情報及び電子地形図(タイル)を使用した。(承認番号 平29情使、第641号)
高さ方向のスライス機能
選択領域のみ表示する機能
鬼怒川の堤防決壊シミュレーション(2015)
動画: 鬼怒川の堤防決壊シミュレーション(2015)
台風のアニメーション
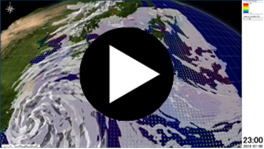
動画: 台風のアニメーション